 OrchardHQ
Photograph the symptom; get a probable cause and the right follow-up.
This is not a generic plant-disease app. A vision model tuned with the tree's variety, the disease vocabulary for that fruit, the season and your local climate.
1. In the field, four taps
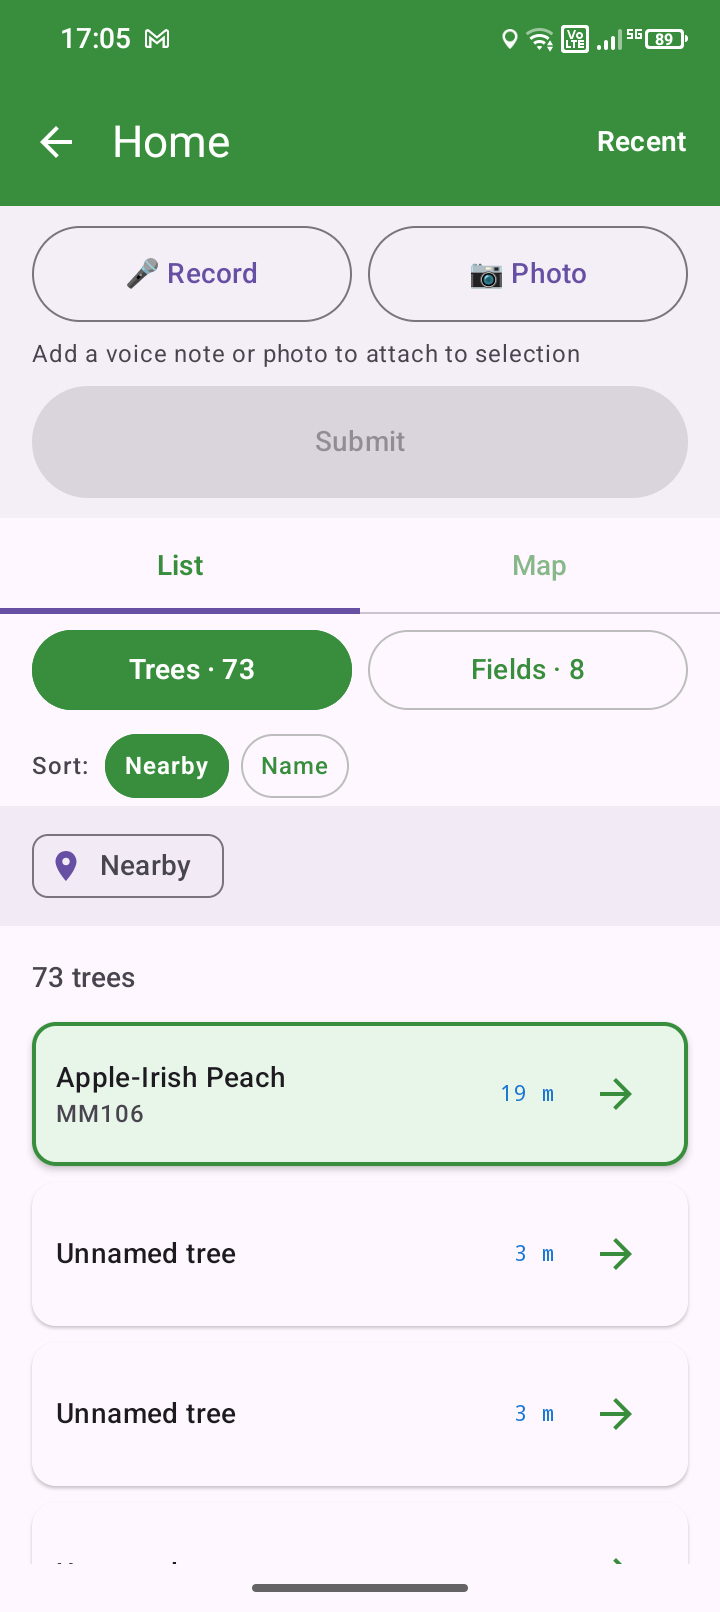
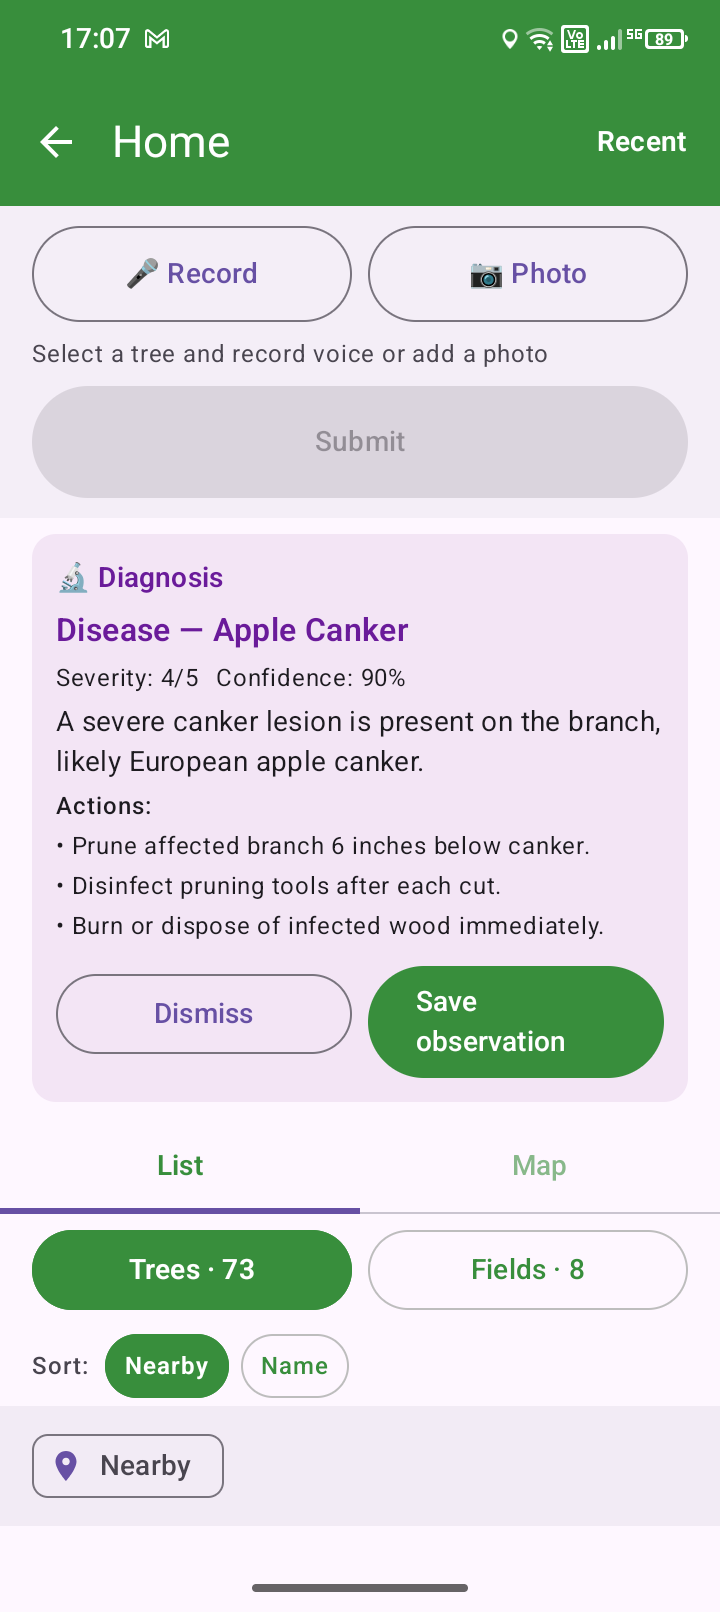
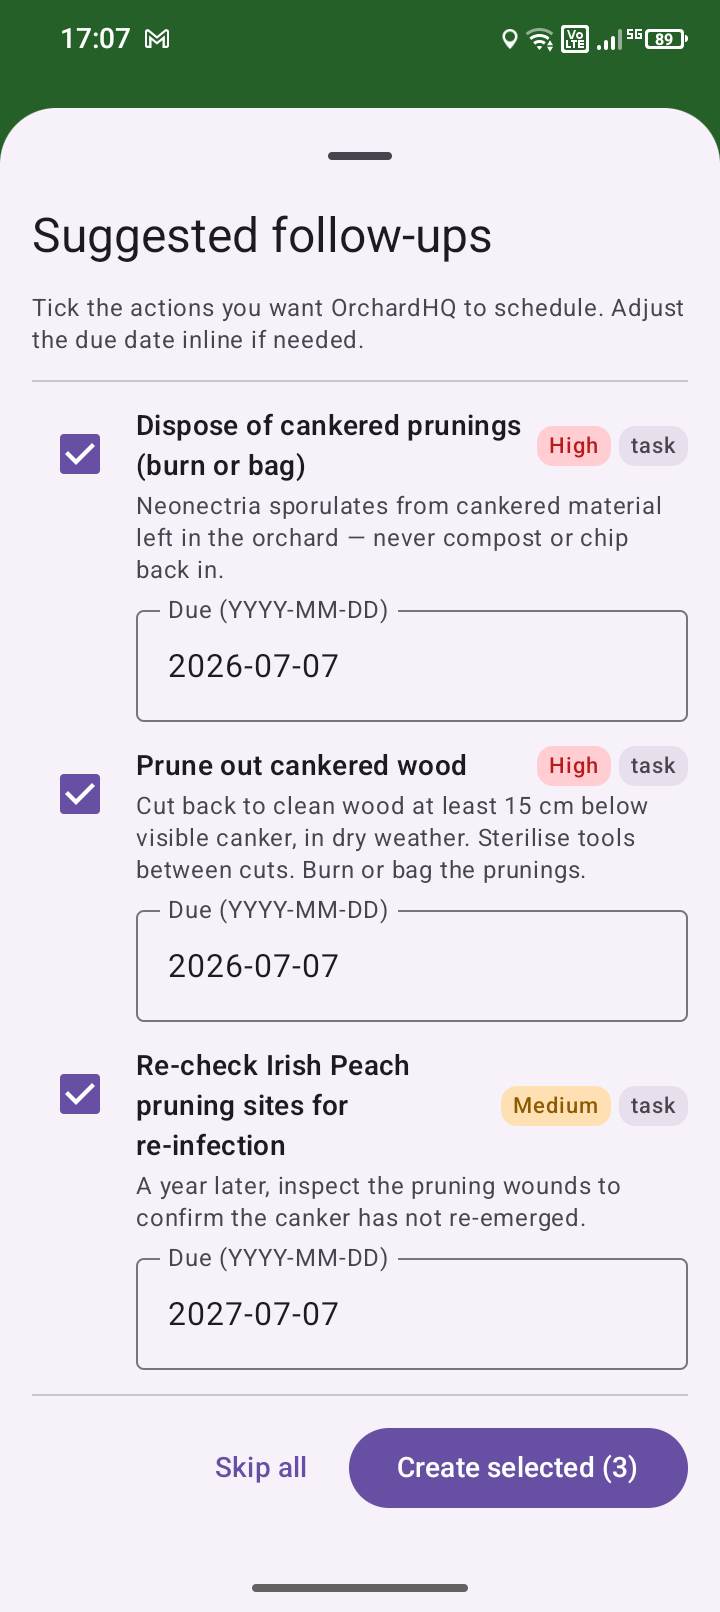
In capture mode, select a tree or row from the nearby list or the map. Take or upload a photo of the symptom — a leaf, fruit, branch or bark; the better the photo, the better the result. We diagnose it with a severity (1 is mild, 5 is severe) and a confidence level. If you're happy with the diagnosis, the observation is saved and OrchardHQ proposes some optional follow-on tasks specific to that disease or pest — pruning, inspection, or clearing fallen leaves, for example.
Prefer to pick? Use the disease picker
If you already know what you're looking at, skip the AI: tap + Observation, choose disease or pest, pick from the fruit-scoped list (apple scab, powdery mildew, canker, brown rot, woolly aphid, codling moth…), set severity 1–5. Attach the photo manually.
2. How the model gets it right for your orchard
We send the photo to the vision model along with the tree's variety, the diseases known to affect that fruit, the season, and your local climate. The observation appears in Recent with a diagnosis tag, and the follow-up suggestions are tickable on the same screen.
3. Back at the desk: history and pressure
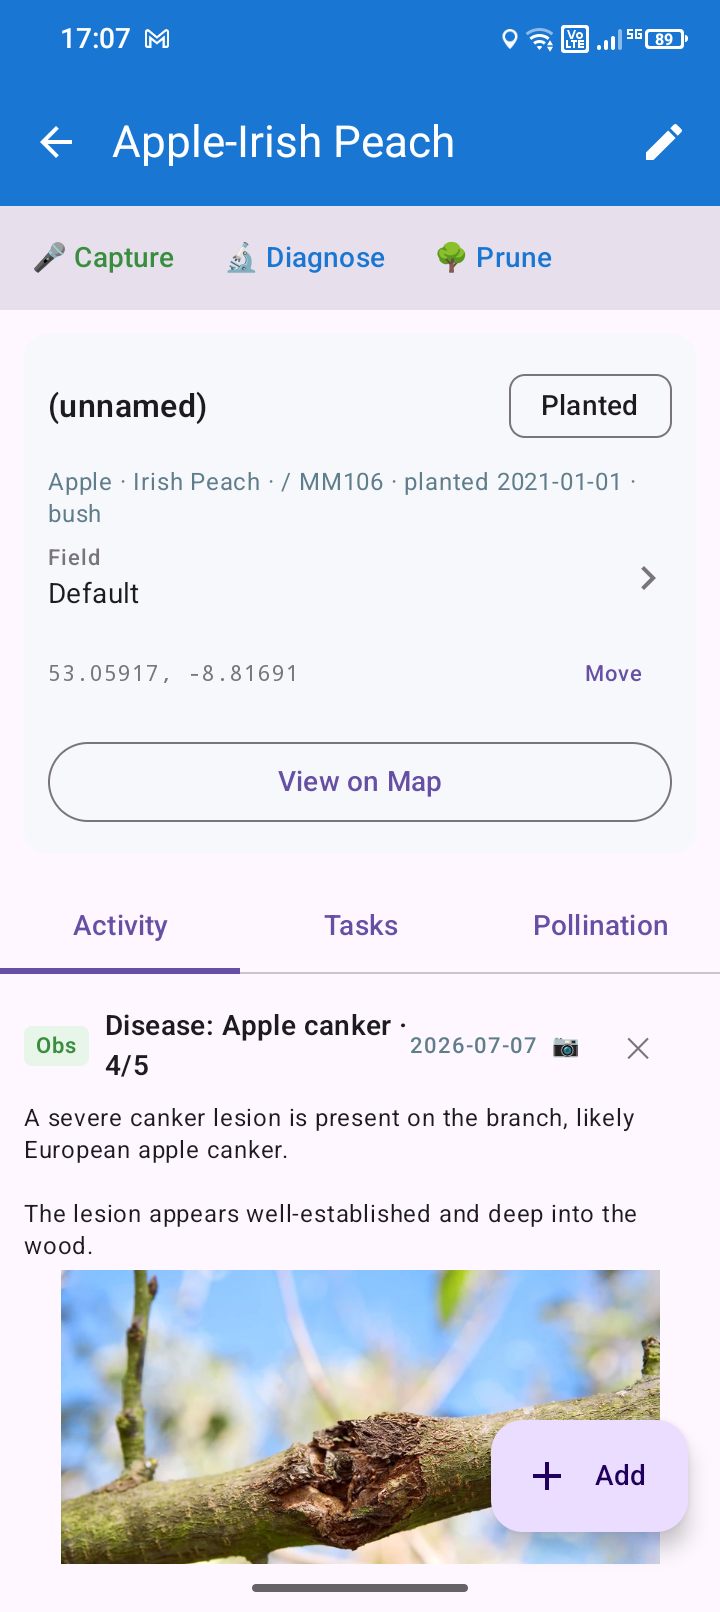
On the web app, the tree's Activity tab shows the diagnosis chain: this year's photo + diagnosis → this year's clean-up action → next spring's follow-up inspection task. The links accumulate into per-tree evidence on whether the diagnosis was right and the intervention worked.
place /guide/images/diagnose-desk-chain.jpg · 1200×680 · per-tree Activity tab on the web app showing a multi-year chain: diagnosis → cleanup action → follow-up inspection → next diagnosis, linked visually
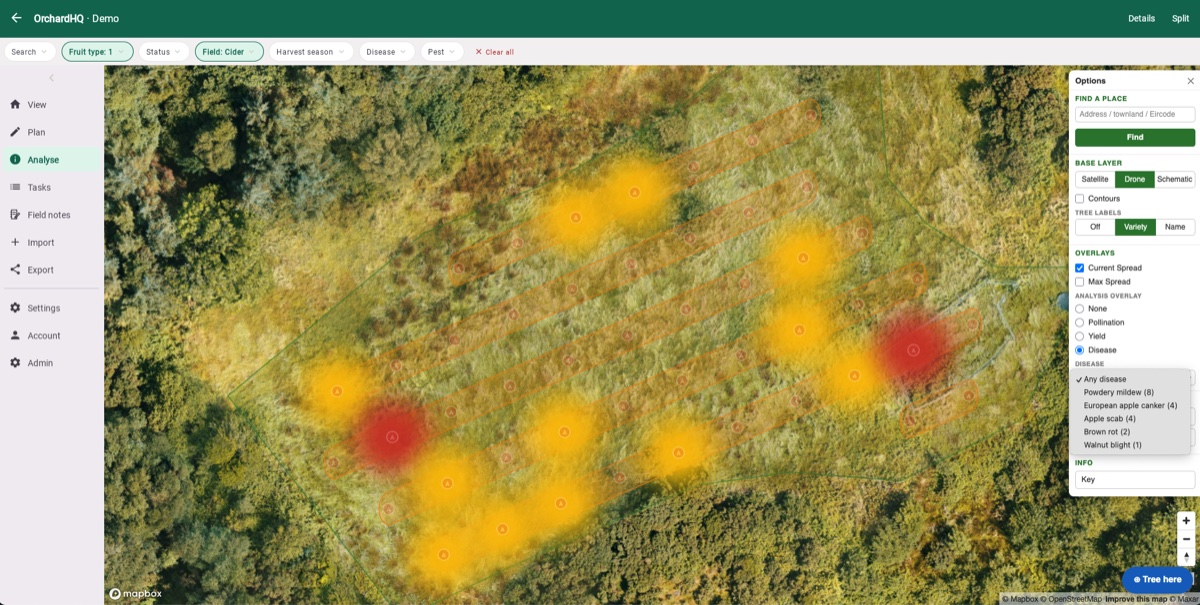
Pressure overlay across the orchard
Switch to the orchard-wide view: the disease pressure overlay maps incidence spatially for the selected disease and year range, so you can see whether scab is concentrated in the damp corner or spreading. Sits next to the yield heatmap and the pollination overlay in the analytics tab.
Limitations and caveats
Diagnose is best on common, mid-stage presentations of the diseases and pests in the vocabulary. Rare conditions, very early symptoms, and anything visually subtle are areas we're still working on. Photos go to a third-party AI provider; that's disclosed in our terms. Diagnose has a generous trial allowance on the free tier.
The diagnoser's job is not to replace your judgement, but to give you a guide in the field. For serious diseases, please consult an expert.
From the orchard
A guide explains; a walkthrough shows. Posts from Frank's own orchard in Gort:

Don't see what you need? hello@orchardhq.app — we'd like to hear about it.
Try the diagnose flow on the demo orchard.
Try the demo → Request access →